Redesigned risk scoring as a horizontal platform solution that became the unified framework for communicating security effectiveness across all InsightVM features and Rapid7 products. Led design strategy that increased risk score adoption and drove 21.2% increase in customers creating reports post-launch.
Business problem & Challenge
Background
Problem
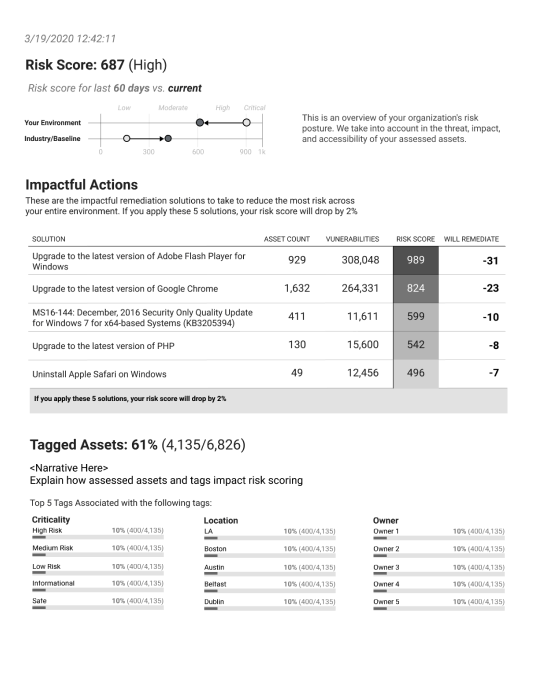
Organizations face thousands of vulnerabilities with little guidance on which pose the greatest breach risk. Security teams needed to communicate risk posture to leadership and help remediation teams prioritize action, but our existing risk framework was failing them. Scores reached millions (making progress feel impossible), lacked context for prioritization, and provided no actionable guidance.
Design opportunity
Rather than redesigning a single component, I treated this as a systematic design problem—establishing a horizontal framework that could scale across:
All InsightVM features (asset management, vulnerability scanning, remediation)
Multiple Rapid7 products (expanding beyond VM)
Three deployment models (on-premise, hybrid, cloud)
This required translating complex algorithmic concepts into intuitive UI, navigating ambiguity around customization vs. simplicity, and building stakeholder alignment across product, data science, engineering, and InfoSec teams.
My Role
Lead Product Designer | Rapid7 InsightVM (2019-2021)
I led design strategy for this project, partnering with a PM, engineering lead, data scientist, and UX researcher. I joined after initial discovery and owned:
Defining design requirements and scope with stakeholders
Leading design direction and iteration based on research
Conducting generative research (planning, coordination, analysis)
Creating frameworks for systematic implementation across the product
Socializing the vision through documentation and presentations
Understanding the Problem
Challenge
Research Insights
Our UX researcher conducted initial interviews, then we shadowed 5 customers using our risk score to validate findings:
1
Progress felt impossible to measure
"Is my security program working well?"
Uncapped scores reaching millions made impact feel ambiguous. Customers couldn't gauge what numbers meant or understand progress.
2
Prioritization lacked business context
“Help me prioritize which security risks get worked on first.”
A small percentage of vulnerabilities represent majority of risk, but few organizations could identify them. Our ratings didn't account for real-world threat intelligence. What attackers actually exploit in the wild.
3
Remediation lacked actionable guidance
“I have a problem — no idea how to fix it.”
Despite discovering thousands of vulnerabilities, we provided little guidance on how to reduce breach risk.
Key Finding: Maturity Shapes Usage
Success is measured by how well a customer could prioritize and communicate risk. These were some behavior indicators we wanted to see:
Increase in percentage of customers adopting the new Risk Score
Increase in customer satisfaction and confidence in the new Risk Score
Increase in adoption of reports/dashboard cards using the new Risk Score
Constraints
There was three versions of InsightVM we needed to consider:
On-premise solution
Hybrid solution
Console-less solution (being built in tandem)
We needed be mindful on how the new risk model would impact these instances. For the initial scope, we decided to not focus on the industry benchmarking(but have a general idea of how this would look like). The basis of the project is the explanation around the risk score itself. Also the emphasis around current available data in InsightVM. The business wanted to make incremental improvements vs a complete lift and shift.
User Research
Discovery
Following the initial interviews, we shadowed 5 customers who were using our risk score. We needed an understanding on how users were using our current risk score. The research gave validation on shortcomings of the current risk score framework.
"When you have a hundreds and thousands of vulnerabilities in your organization - which one should you give attention to? How do you know what is a security breach bomb waiting to happen or just a slight misconfiguration?"
Our current risk scoring mechanism did not provide a lot of value to our customers. Customers had a challenge understanding the progress of their program. Since it's linear function time, customers feel like it's always a losing battle. If the customer has been using VM for a while, their risk score was massive - the numbers would be in the millions. Our score should allow the customer to feel safe when warranted. Our current risk score could not calibrate pending on business needs. This led to unmeasurable and ambiguous knowledge of impact.
We also saw different usage of risk score depending on the security program maturity of the organization: First segment are more likely to rely entirely on the built-in risk score for prioritization and communication. Second are more likely to want greater customization or even using their own risk score algorithm. The most mature segments are also more likely to use the risk score to automate workflows, export data into another tool for analysis, and want a complete view of risk across their entire security program.
Key Insights of risk score needs
Capped
Fixed min and max even as things are added
Intuitive
Easy to understand what score means at a glance
Extensible
Enhance with more threat and business context
Dynamic
Model evolves over time as more inputs are added
Normalized
Distributed scores to allow for comparing groups
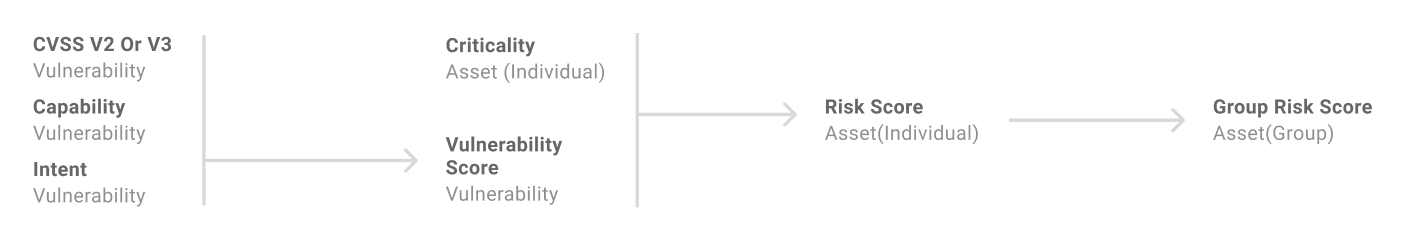
Defining the Vocabulary
To keep the framework aligned - we defined the vocabulary and language. We defined Risk as an intersection between opportunity, threat, and impact:
Opportunity: Whether the vulnerability or misconfiguration exists in the customer's environment
Threat: Whether an actor has the capability and intent to exploit the opportunity
Impact: The effect on the business with the successful exploitation of the opportunity
Vulnerability Score
Inherent threat assessment of a vulnerability independent of the asset/application.
Takes into account the CVSS, opportunity, capability and intent of a vulnerability.
Applies to an individual vulnerability definition
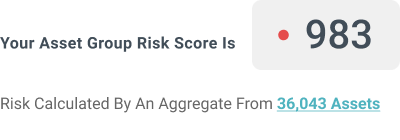
Risk Score
Assessment of risk posed by a specific vulnerability instance, asset or application.
Takes into account the threat, criticality and accessibility of the asset or application.
Apply to an individual or a group of vulnerability instances, assets or applications.
Design Iterations through feedback
Exploration
Testing the Content + Iteration Process
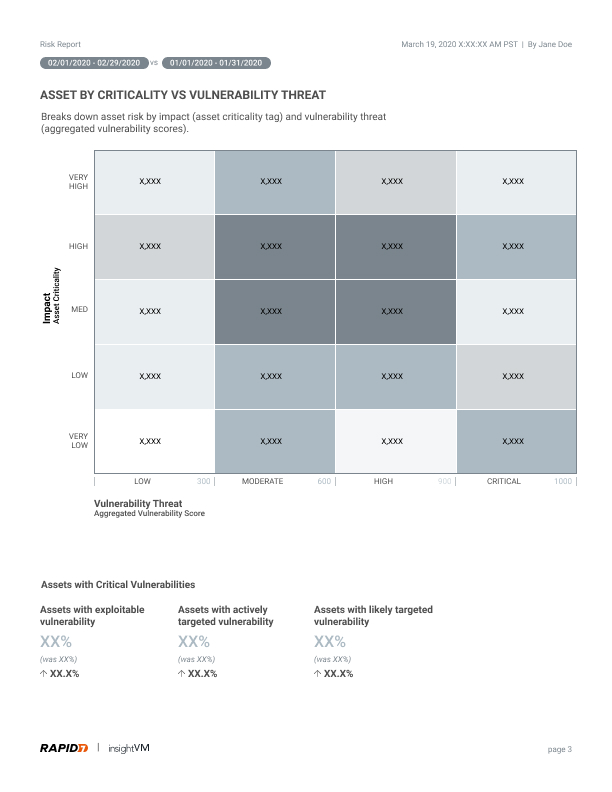
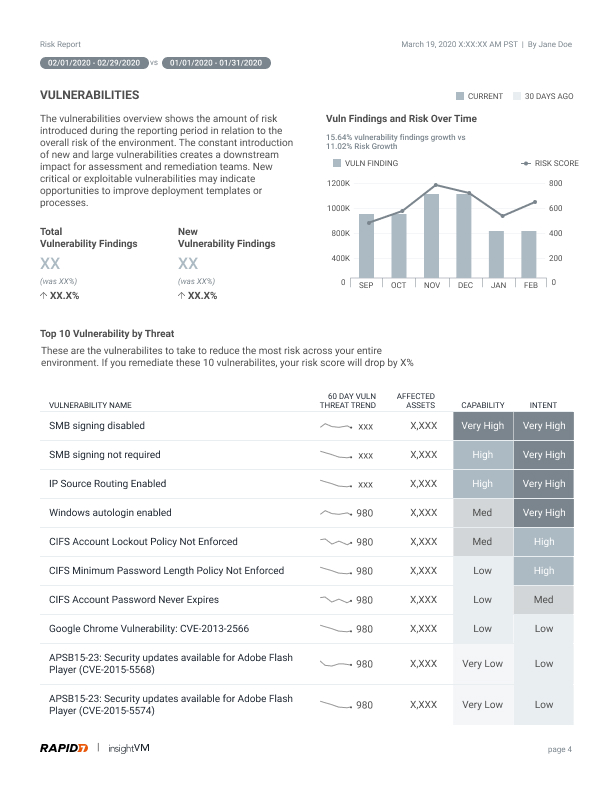
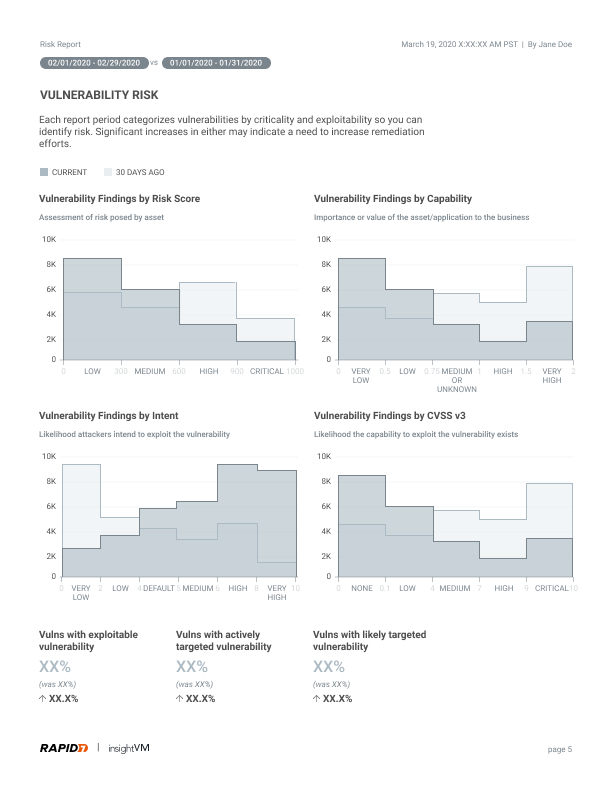
Risk is something we had to embed in the entire product - but we wanted a faster way to get feedback on the core content. We decided to test the content with a static PDF report using the new risk 2.0. framework, attributes, and learnings from previous research. The PDFs content leveraged the initial user research and feedback from roadmap calls.
This served as a scoped hypothesis for the new risk scoring framework to the Insight platform. We put this to test if this can be used by security teams for effective prioritization and communication across their security program:
Help our customers to better communicate risk posture
Prioritize security risks for the remediation team to take action
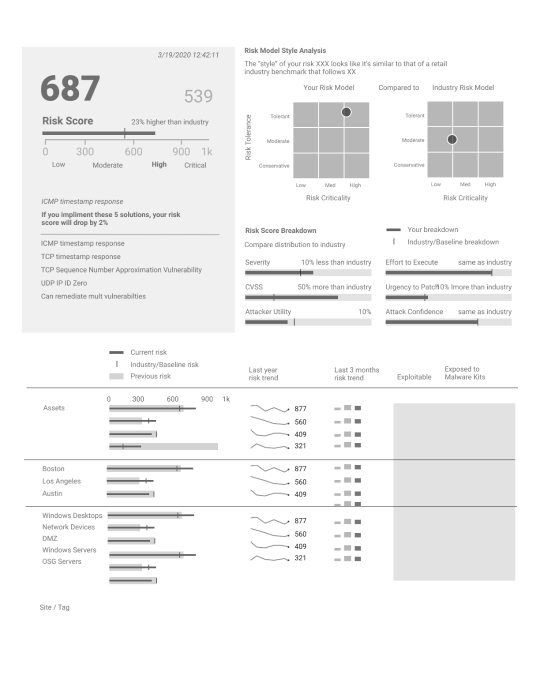
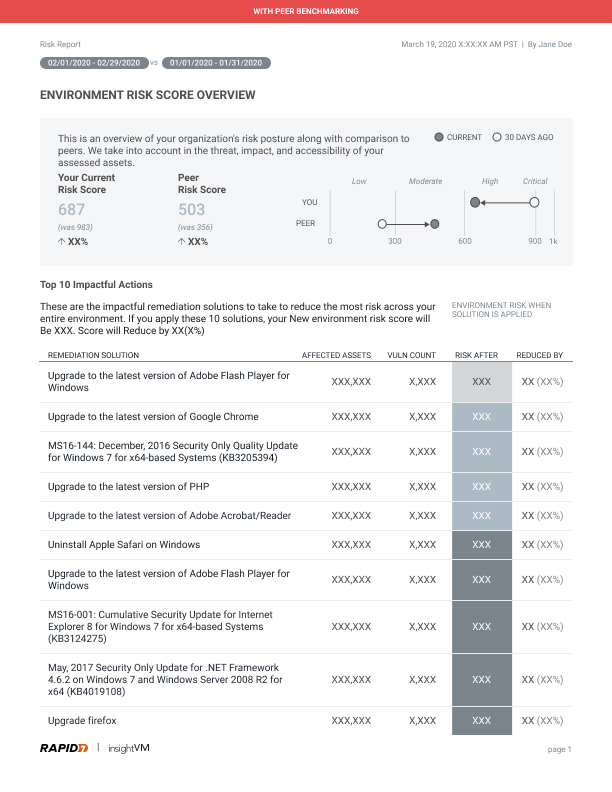
Design Iteration 1: Makeup of Risk Tolerance
Style of risk model pending on customization
Initial design showcased the makeup of the risk score related to the risk tolerance. My intent was to illustrate the style of the risk model depending on the customization. Industry comparison section of the design was well received but there was a lot of confusion around customization worked. I have gotten feedback we should pivot the direction toward showcasing the makeup of the score.
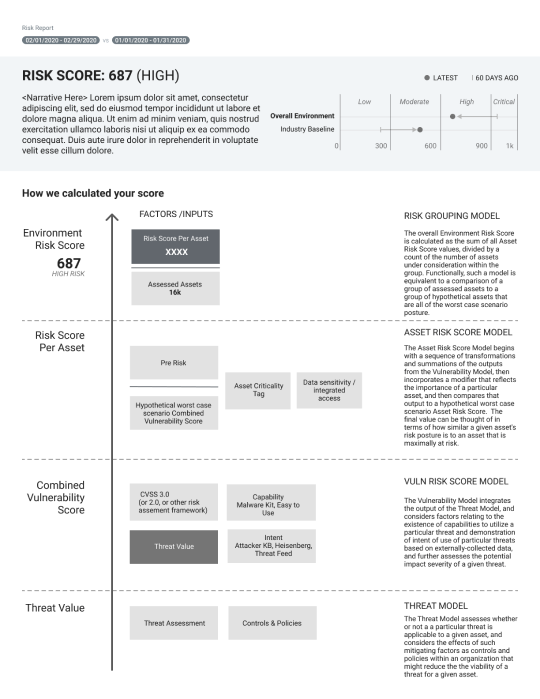
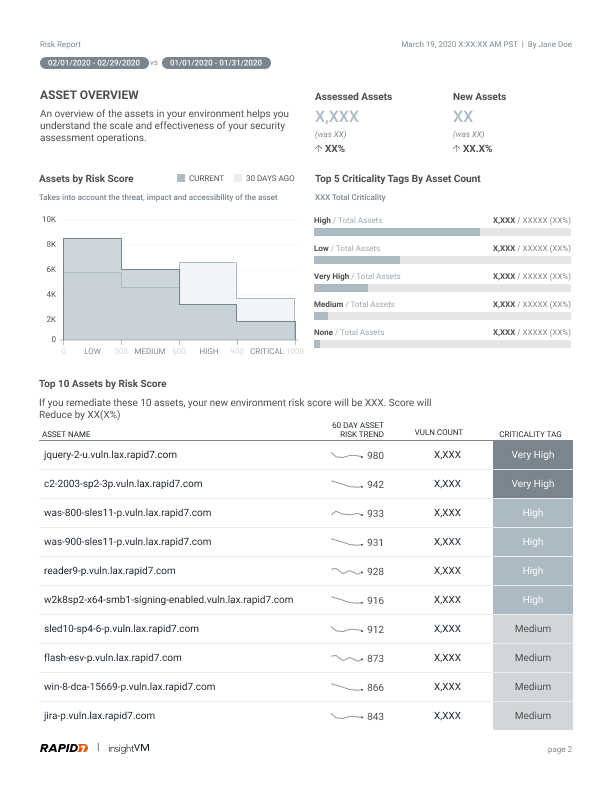
Design Iteration 2: Peel the Onion
Breakdown of environmental and temporal factors
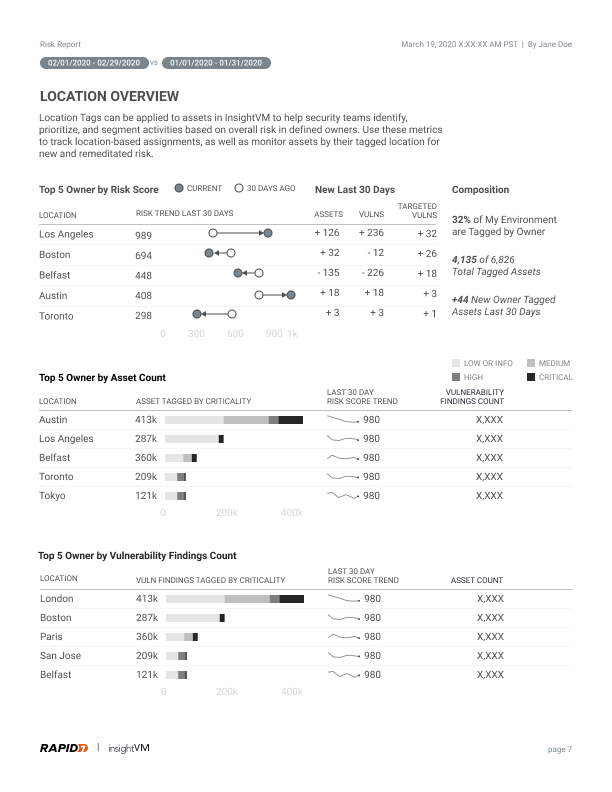
Second iteration focused on the breakdown of environmental and temporal factors. Customers could “peel the onion” and show the factors of the score.The design segmenting the contributing factors got a positive reaction. Tag, owner, and location were the segments. As the majority of the primary real estate focused on breakdown - got feedback most customers would use the score out of the box. These were the segments who made minimal configurations. There were also concerns about how actionable the report was.
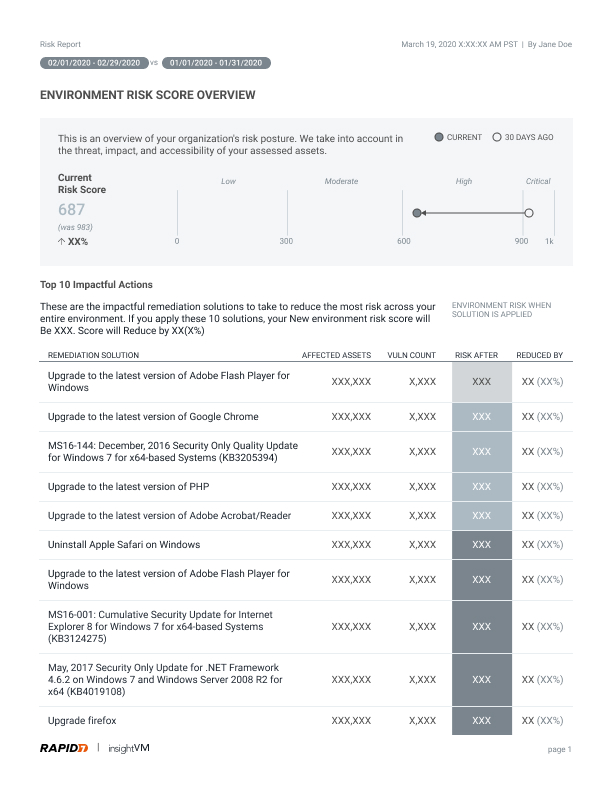
Design Iteration 3: Focus Around Actions
Inspire action by how much impact a remediation solution has
Next iteration focused on ways to inspire action from people.I decided to add more information around how much impact an action can make. To add emphasis, I reordered the remediation solutions and impact on the initial page.This design had good reception from our subject matter experts and our infosec team.
Final Content + Design Direction
It was critical to also keep the same representation for risk models to keep a consistent experience. Though the design iteration, we learned these key insights on what our users needed:
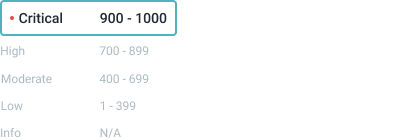
Explain Score Severity
How does the category of this compare? What are the breakdown of the scores?
Explain Score Make up
Transparency around what impacts the score? What’s the data source?
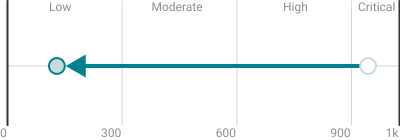
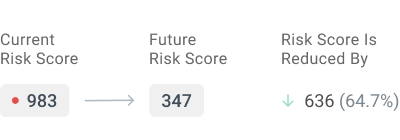
Showcase Change Over Time
Understanding of progress made. Change in risk score last 30 days:
Visualize Future to inspire action
Is it worth going through the effort? How much impact can an action make?
Finally, I handed off the initial PDF prototype to our data scientist. This PDF prototype served as a reference for reformulating the model. He iterated on a readable spread and variation to match the design. As he reformulated the environment risk score, we continued to collect feedback from customers.
We now needed to embed this framework as a common language in the product. This translated into keeping track of what components were making up the score, what related content did, what it needed to be associated with, and where should this be exposed in the product.
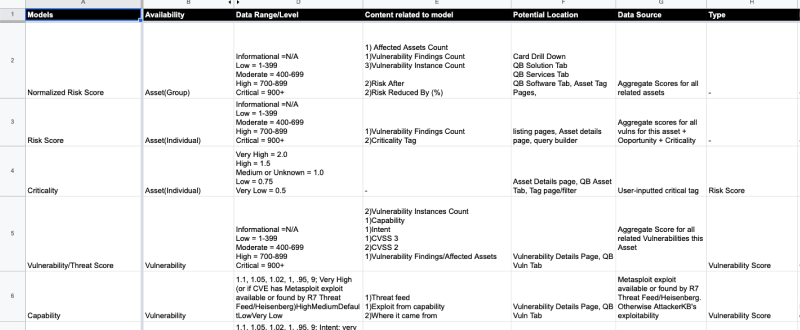
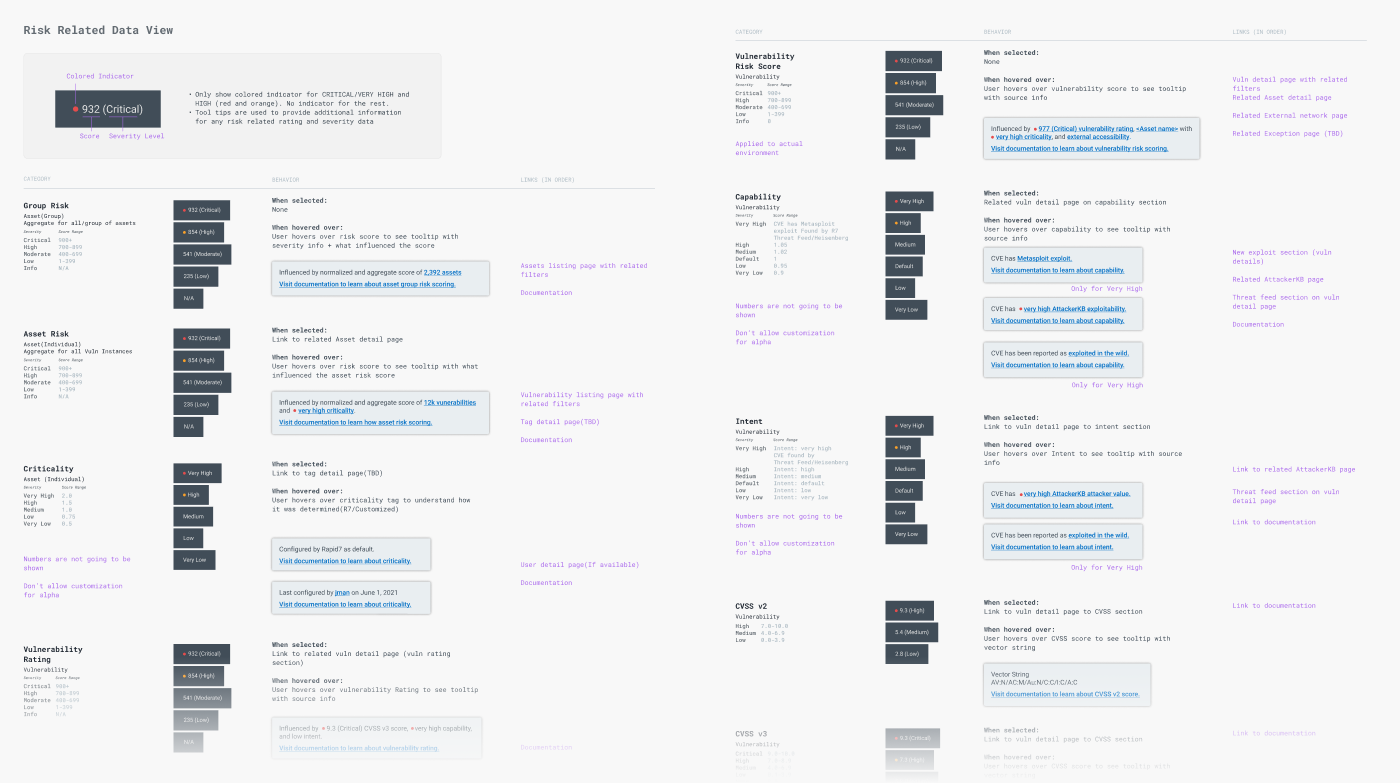
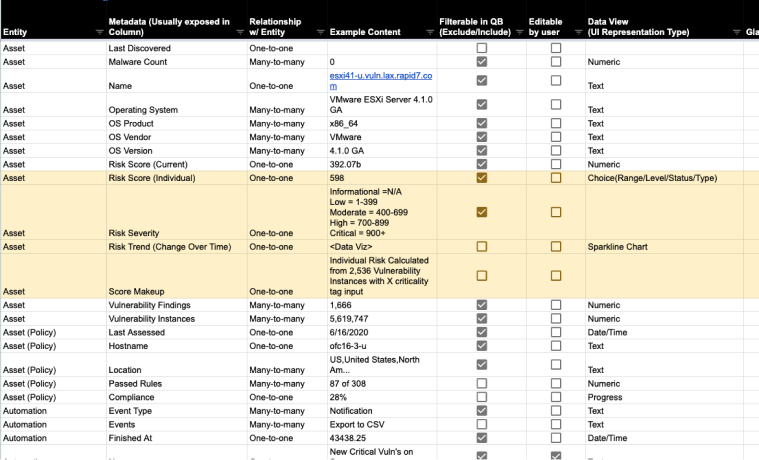
Content
What is the risk information and relationship between our current entities?
The content was critical in deciding how the design worked and looked. Risk score needed clarity on the makeup of components. To keep track of the data, I did a content inventory of our entities and leveraged the findings from the PDF prototype. The content inventory helped me think about how a risk model relates to an entity.
For Assets, we needed to show how a criticality tag influenced the score. Influences of vulnerability score were capability, intent, and CVSS score. A remediation solution should clarify the affected assets, associated vulnerabilities, and impact. Customers wanted to see impactful actions prioritized by the highest risk score. With the team, we defined scope and prioritization pending on the version of the design.
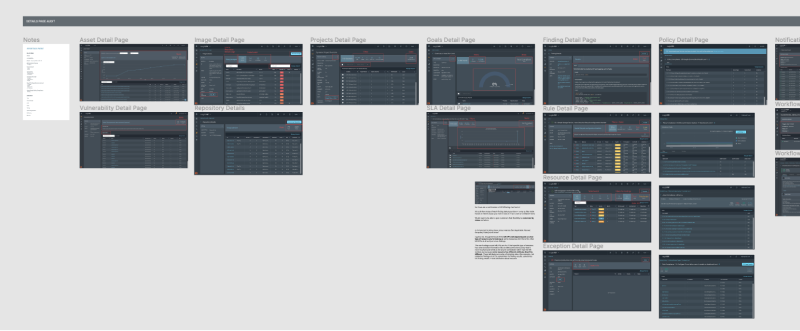
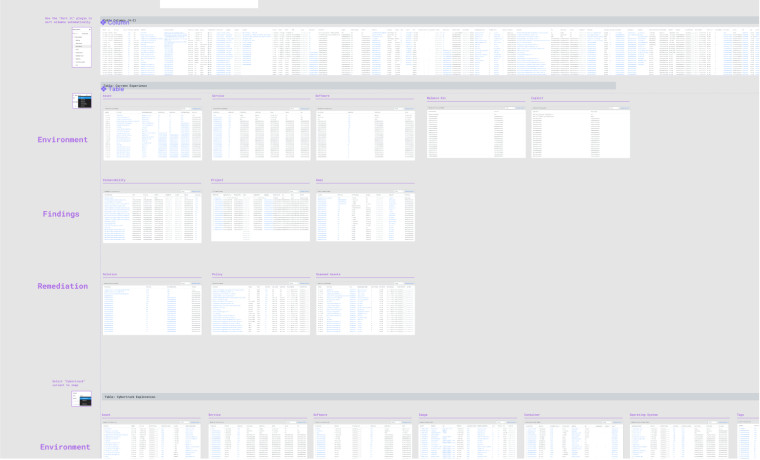
I focused on the risk content and location to map how risk fits into the InsightVM ecosystem. I audited our product to find what areas we could expose this new risk information. This helped to keep track of how the content could apply pending on context of the entity. Mindful of the design debt, I focused on understanding the content relationship. A content-first approach would prevent the creation of silos and redundant duplicity.
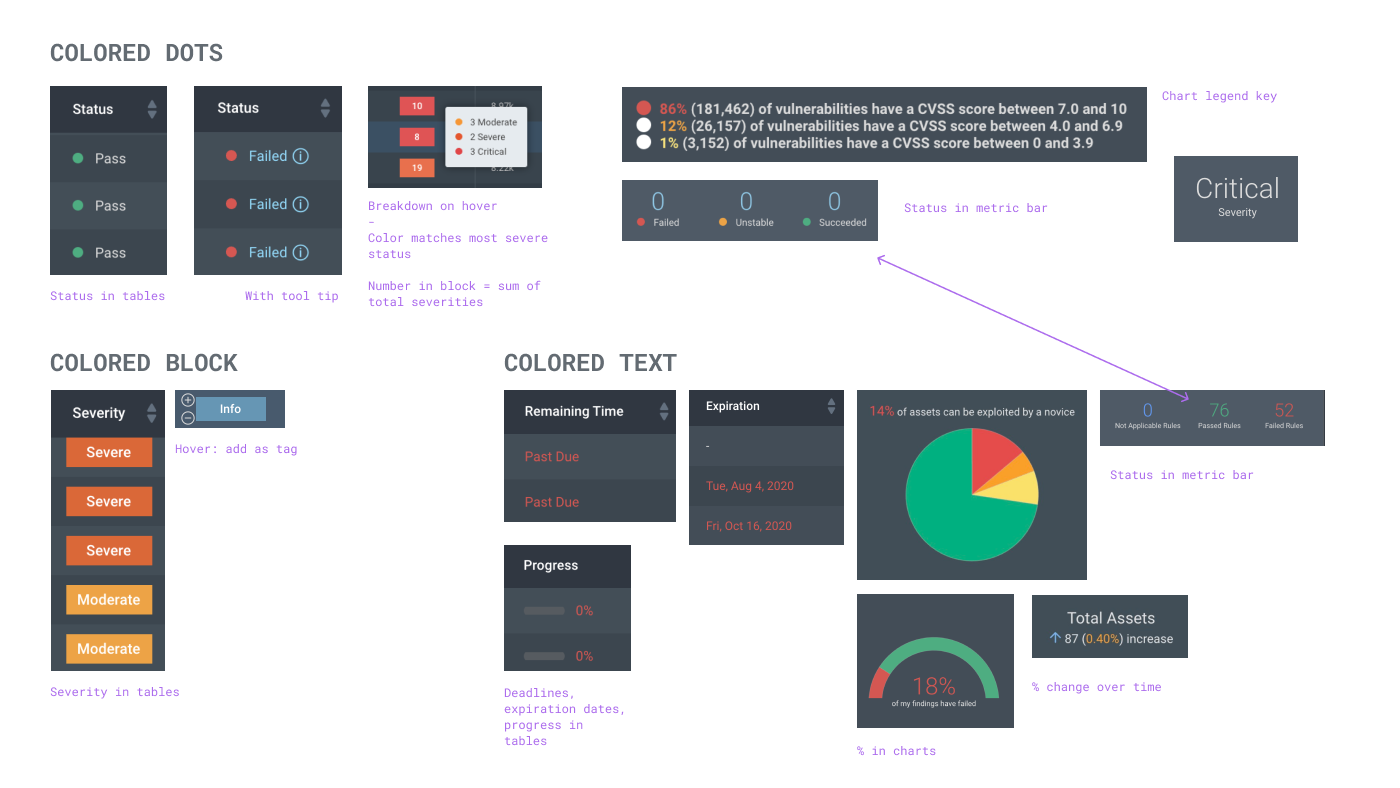
Currently InsightVM had an inconsistent view of status and severity. We already had various representation depending on the designer. There was low value in adding another variation unless there was a good reason. I wanted keep the same representation for risk models for a consistent experience. This led me to audit the current experience.
After the auditing - I consolidated the statuses to a simple indicator component. To have a high signal to noise - I decided to add a guideline to only show the indicator for only critical statuses. This solution was generic but flexible enough to apply to the list of scenarios listed in the audit.
There was different type of score makeup depending on the type of risk score information. I detailed out the expanded score makeup content for our developers. This summary view focused around scalability and gets a high-level overview quickly. Deals with limited real estate. Mainly provides a funnel towards the expanded view and provided an entry point to funnel into the expanded view.
As we embedded the new risk information, I also wanted to address cross-linking. There was accidental duplicity and prompted inefficient navigation in the past. For example, we would have two views of the same information in the product as a peek panel and a detail page. Also a lot of the links were dead so we were not taking advantage of contextual navigation. I made a content inventory to keep track of this information and communicate with our developers. I also used the Figma nesting component(+ variant) functionality organize and apply the table content. Other designers could also leverage this low fidelity library to keep the content consistent in other pages..
Content Inventory: Research Defined The Content. Content Influenced Design Representation.
Design Toolkit for Table Content: Finding Opportunities in the Current Experience
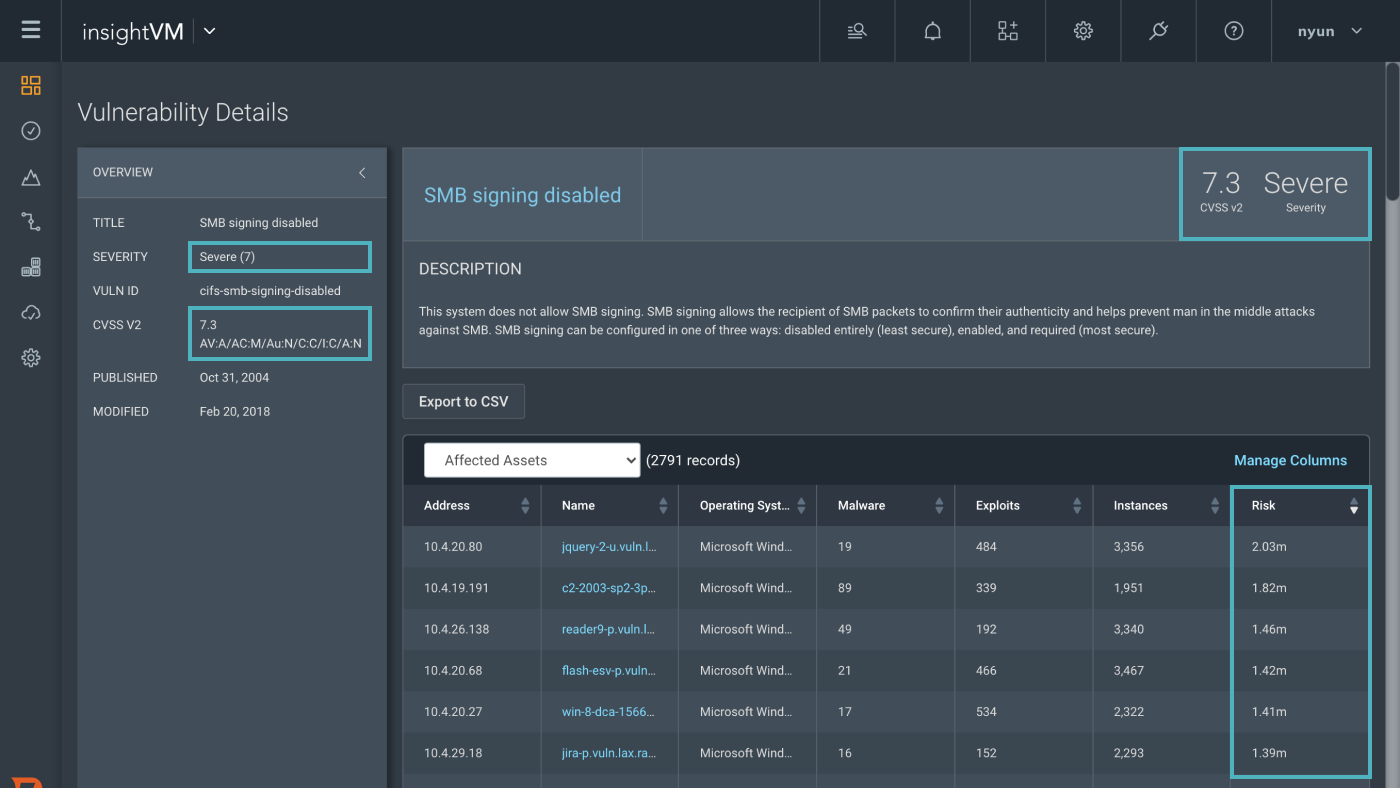
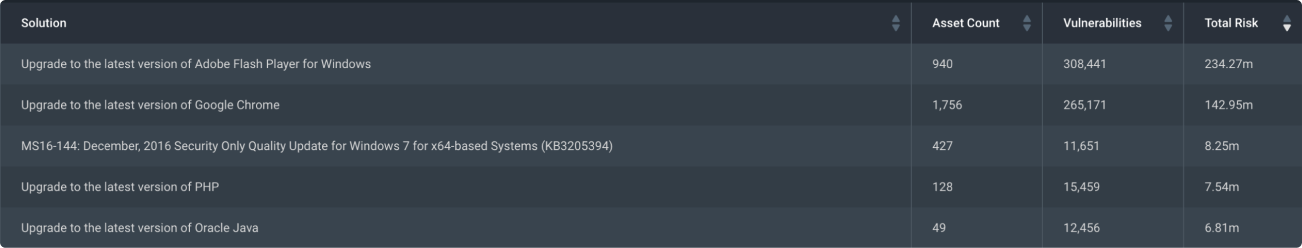
From the documents and specifications - our engineering team updated the pages. This is an example of how the content got updated:
Before
After
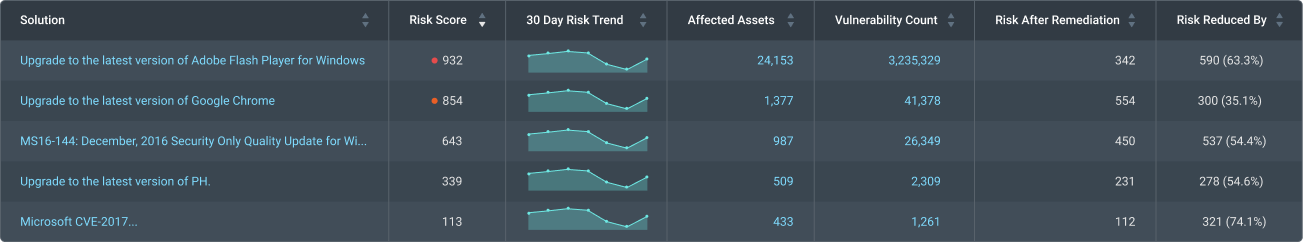
Remediation solution table with updated risk info + cross-linking
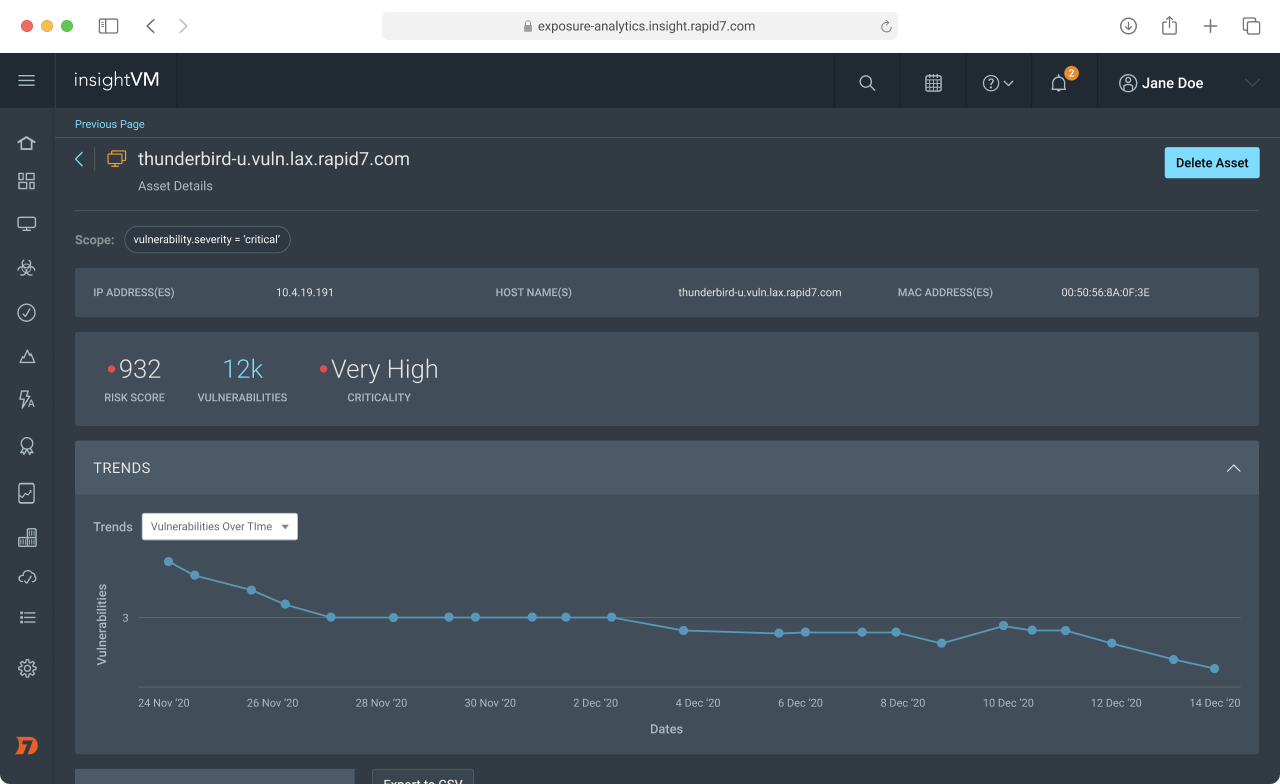
Before
After
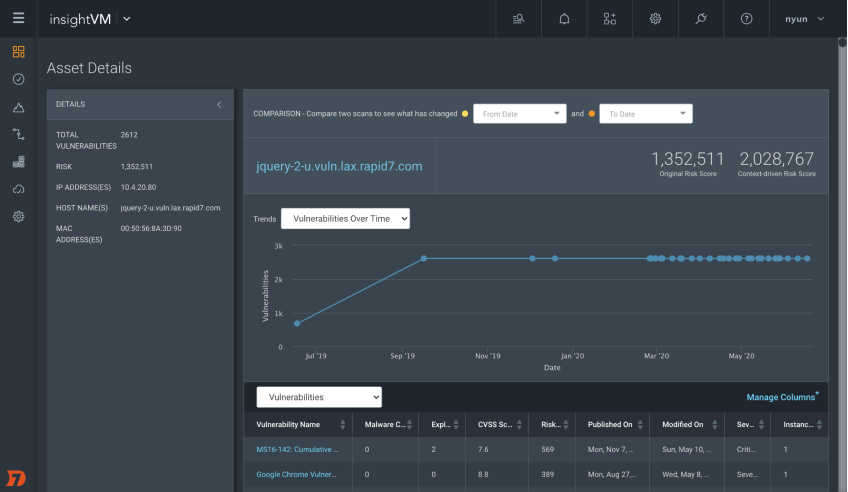
How the previous asset detail page looked like
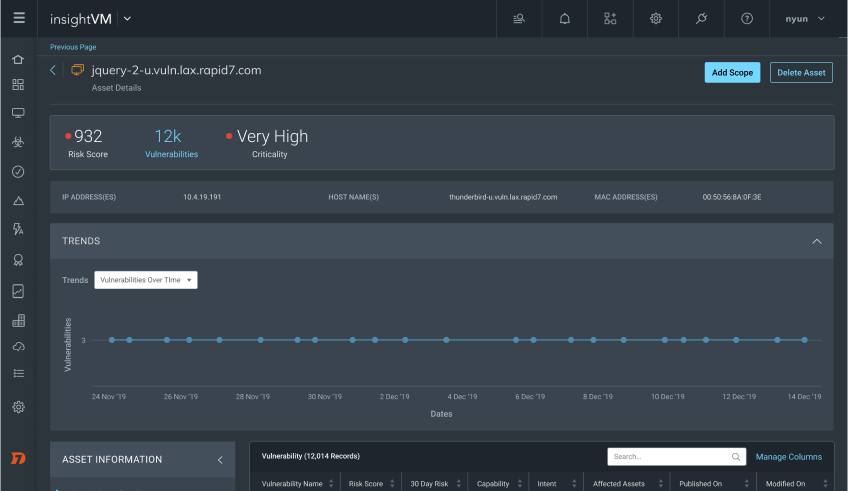
New risk model and design component applied
Takeaways
Learnings + Next Steps
Since the team been tackling this project, we have gathered great feedback to help us iterate. This has influenced the change and this is only the starting point as we move toward general release.
Here are some feedback we have gotten after the alpha release:
“Great products that help us find and manage vulnerabilities, monitor security and chart the progress of initiatives......helped us to democratize security efforts to downstream retail and manufacturing security teams.”
“Product and tools are very capable, no issues with deployment and execution, results provided in multiple formats, user interface is simple to navigate, very good detail of results with mitigation steps provided in a clear and concise presentation.”
This project gave me a relearned respect for content. I had to curve my instincts to work on the design of the risk model over focusing on content discussions. Focusing on the content kept the team on track while discussing what was important. It’s overwhelming to work on a design if we have a long list of things we want without going through the constraints. Scoping down the design helped to keep the discussion focused. It was critical to lead the dialogue of the future while being tactical. There is a longer term opportunity to evolve the framework as a platform service. Also to provide portfolio customers with a program-level view of risk.